Test for Notebooks 1 - 4#
Python Calculator
For this test we will not use the in-line jupyter cells that we have been using with the sphix-thebe extension. Instead, we will use the Python Calculator.
Clicking the link above will open the Python Calculator in a different tab in your browser. Once the message 'You may begin!' is printed, feel free to start coding.
You can solve the entire exam in the same tab, or open different tabs for different exercise, however you prefer. Good luck.
Note: For some exercises you will need to load some files. They are located in the following path: data/notebook1-4_test/
Exercise 1#
Write a function that plots a square centered at the origin. The length of the side of the square is \(L\). The input of the function is the length \(L\).
Next, write a loop that calls your function for \(L\) going from 1 up to and including 5 with steps of 1.
Use plt.axis('scaled') to make sure your squares look like squares and not rectangles.
Exercise 2#
Write a function called countsquares that takes as input the filename of a file that consists of a bunch of numbers separated by spaces. Inside the function, you must first read the numbers from the filename and then you must determine how many of these numbers are a perfect square. A perfect square means that the root of the number is an integer (i.e., 1, 4, 16, 25, etc.). The function returns the number of perfect squares in the file. Note: to convert a number to an integer, use the int function.
Demonstrate that your function works by using the file numbers2016.txt and execute the following line of code:
print(countsquares('numbers2016.txt'), 'numbers are perfect squares')
Exercise 3#
The file quiz_answers.dat contains the result of a small multiple-choice quiz with 8 questions. Every row contains the 8 answers to the quiz of one of the students. Your job is to count how many students had the correct answer for each question. Write a double loop to compute the number of correct answers for each question and present the results in a bar graph. The correct answers for the 8 questions of the quiz are: a b c d a b c d
Exercise 4#
Create the flag of Norway as shown in the figure below.
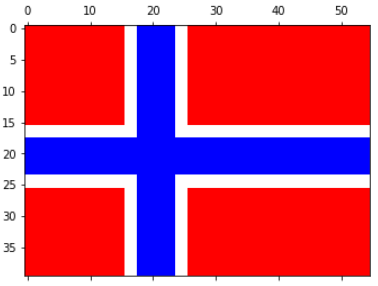
Create an array of size 40 by 55. Fill the array with zeros, ones and two-s to represent the blue, white, and red parts, respectively. You may only use a maximum of 5 assignment statements to set the correct values for the colors. Make sure you plot the flag using the colormap bwr (which stands for blue-white-red).
Exercise 5#
Write a function that computes the percentage of grades that is above a given value. The function takes as input arguments an array with grades between 1 and 10 and a minimum value and returns the precentage of grades (so between 0% and 100%) that are above or equal to that value. Demonstrate that your function works by loading the grades in the file schoolgrades2016.txt and print the result of the function to the screen with two decimal places, given a minimum value of 7.
Brief answers#
You probably know what this should look like
93
Q1: 4, Q2: 4, Q3: 5, Q4:3, Q5:5, Q6:5, Q7:4, Q8:4
Your graph should look like the provided figure
31.3