Fault Tree#
A fault tree is a graphical method for representing a number of components and how their state determines successful operation or function of a system. An example illustration is provided below, where one can observe the following:
the diagram represents the function of (unknown) “Subsystem A”
there are 8 components, which have been arranged into 5 sub-subsystems
the composition and function of the sub-subsystems are represented by “gates” of which there are two types (“AND” and “OR,” defined below)
Each gate represents a probability of failure that is related to the failure probability of each component
The system failure probability is computed by starting from the bottom, and working up to the “top event” (i.e., failure of “Subsystem A,” in this case)

Gates#
The gates in the fault tree approach represent how the collective function of the components result in successful operation (or failure) of the system. There are many types of gates that can be used in this method (see, for example, the Wikipedia page); however, we will consider only two, “AND” and “OR” gates, as these correspond to parallel and series systems, respectively.
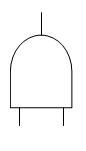
“AND” Gates#
An AND gate is represented by a symbol with a horizontal line on the bottom, as illustrated below. It represents the case where failure of all of the components results in failure of the sub-system (hence the name “AND”); a parallel system.
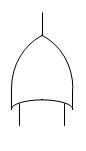
“OR” Gates#
An OR gate is represented by a symbol with a concave-down curve on the bottom, as illustrated below. It represents the case where failure of any of the components results in failure of the sub-system (hence the name “OR”); a series system.